
We had the opportunity to revisit Slump E this summer and it was a thrill to see how much it has changed! In addition to appearing larger since our last visit, the quality of the material being released by the slump appears to have changed. While the material was quite thick last summer (although, runnier than what you see in the "thawed permafrost material" video below), this summer the material was less viscous and the sediments in our water samples settled out more completely. This might explain why the slump's "debris tonuge" - the lobe of desiccated permafrost material extending from the thaw slump (formed by the erosion of sediment and rocks from the thaw slump and its entrainment in the stream valley below) - was more solid this year. Despite this, the headwall is still quite active, as shown by the first video below. We were lucky enough to install a game camera on the hill opposite Slump E this summer. The camera served as our eyes on Slump E while we were away, recording photos every hour. We have yet to begin processing photos, but are excited to uncover the story they hold. Stay tuned!
|
As a field ecologist, I feel at home in the field. Whether trudging through tussock tundra, slowly sinking into a pool of thawed, saturated permafrost clays, or (sometimes preferably) zooming across the Mackenzie Delta in a helicopter, I can't imagine a more rewarding way to study Arctic systems than being immersed in them. Returning from the field and adjusting to life back in 'civilization' can feel strange. However, it won't long before we once again start planning for the next field season. In the interim, I'll be spending much of my fall running samples in the laboratory and analyzing data. It's a thrill to see patterns emerge in data (or sometimes not!), much like a story that emerges from a puzzle as it's pieced together. Like the lid of a puzzle box, our research and pre-field season planning helps us envision what stories might emerge from our fieldwork, but there are always surprises. I immensely enjoy this and the time out of the field spent analyzing data and piecing together a small part of the puzzle that will reveal how arctic systems are changing. One finding leads to 10 more questions, which drives our return to the field. In this sense, the puzzle of Arctic systems is never complete. New pieces emerge constantly and it's a thrill to study them so that we better understand the Arctic's fascinating, inspiring, and ever-changing story.
Five days. Five slumps. Read about them below! Slump A 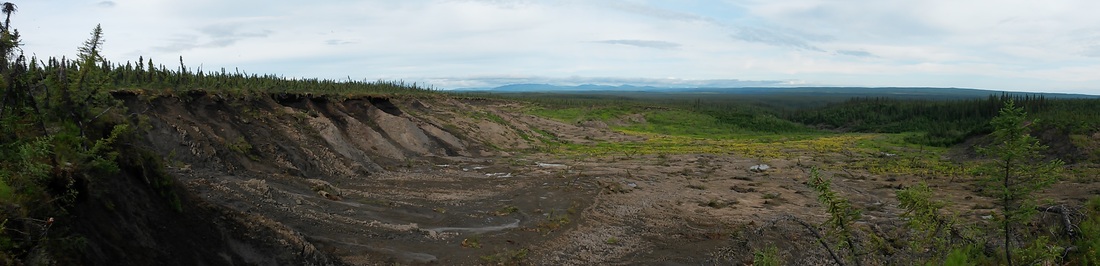 "Slump A", looking northeast across the slump floor towards the Mackenzie Delta. 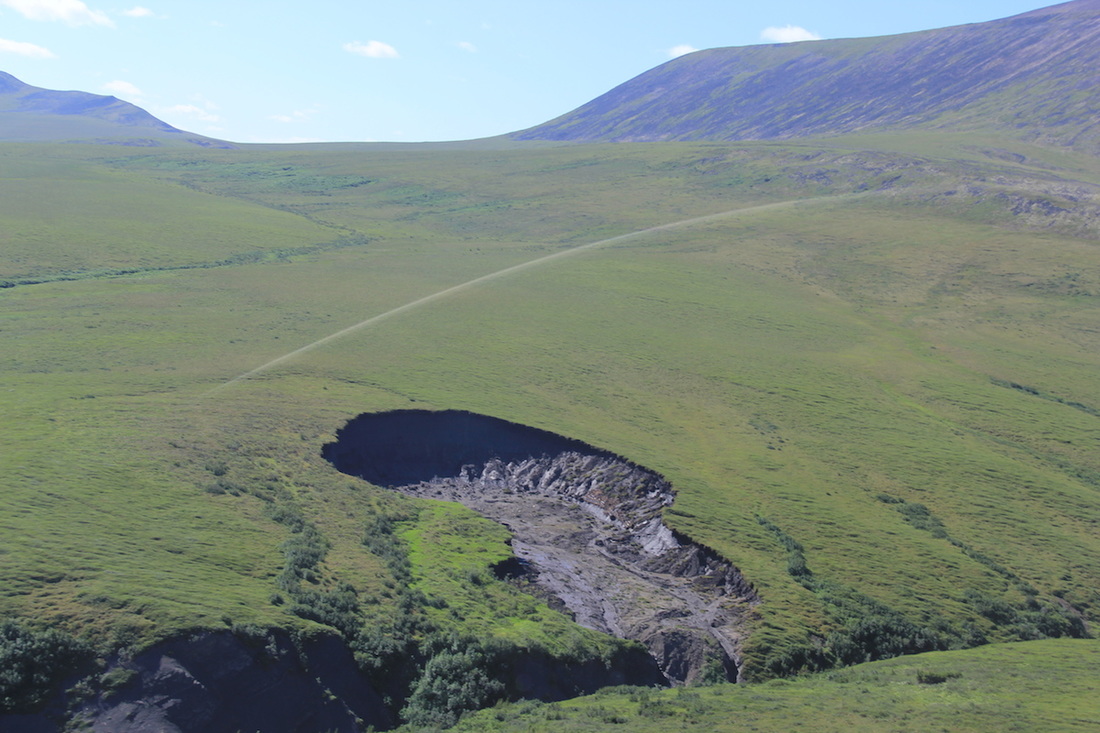 "Slump E", looking southeast towards the Richardson Mountains. This is a new site for us in 2015 and is a spectacular one. The permafrost at this small but deep slump has thawed down to the shale bedrock. Larger rocks eroded from the thawing headwall pulverize the shales on their way downstream, creating an organic- and sediment-rich slurry cascading over the bedrock and into the stream valley below (see video below). A highly active site and an exciting one from the carbon cycle perspective! 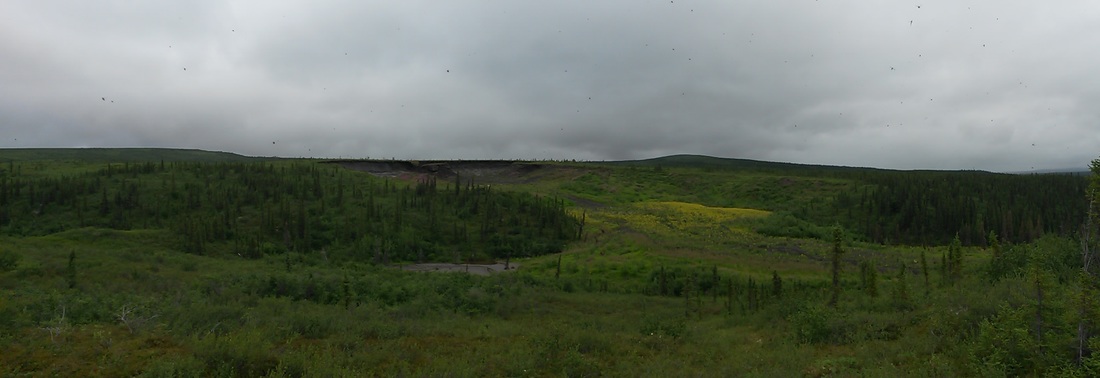 "Slump C", looking north towards the headwall and revegetated debris tongue of eroded material emanating from the slump. Slump C has grown considerably in the past 2-3 years, as its ice-rich headwall faces the (often, but not in this photo) fierce midday sun (see photo below). 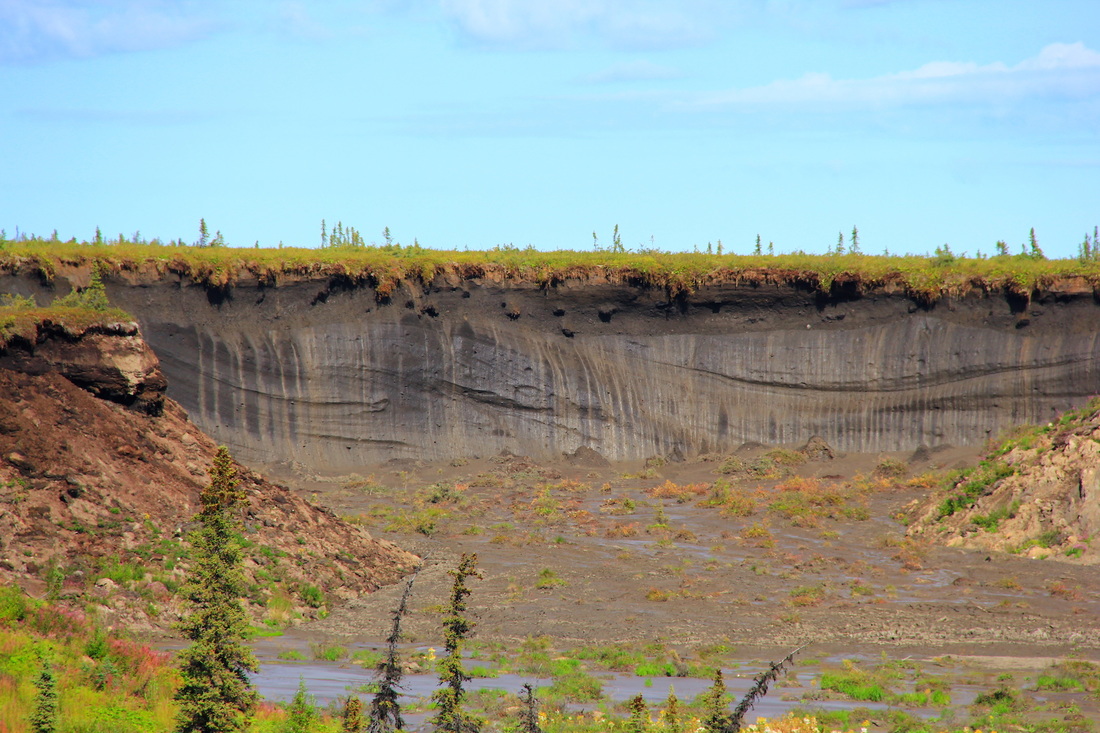 Slump C headwall (2014). The headwall is ~10m high and is mostly ice beneath a 1-2m active layer of material that thaws and re-freezes every year. 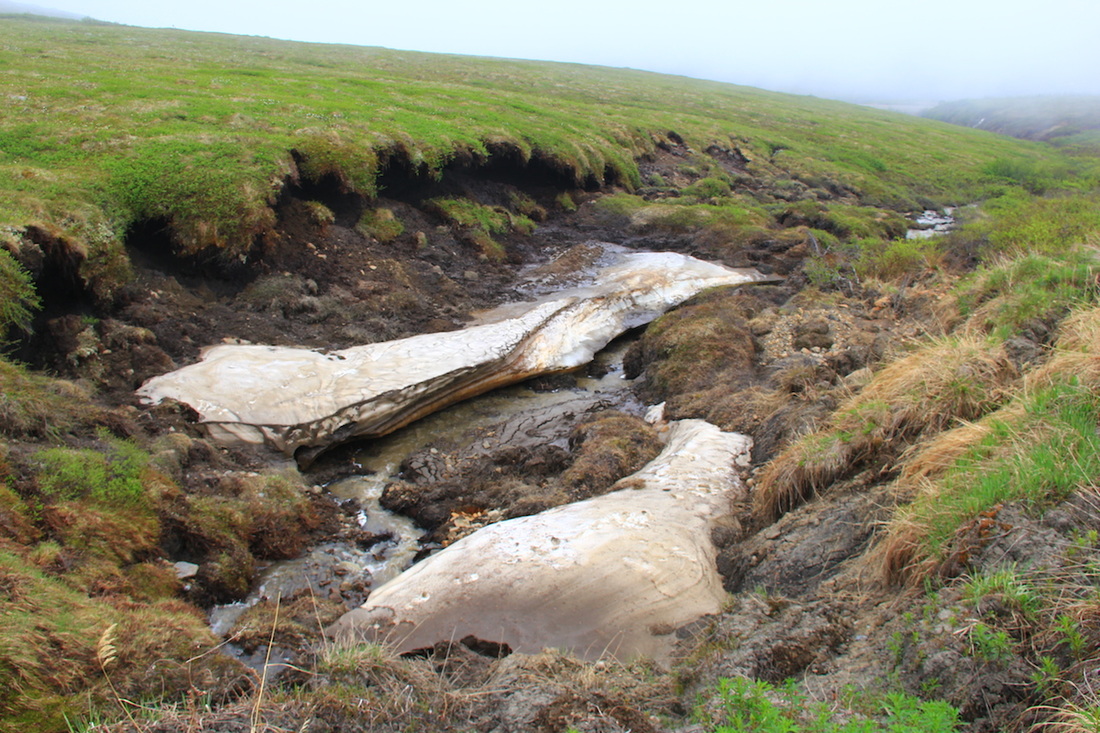 "Slump D", looking south towards the Dempster Highway. While still a relatively small slump (~2m headwall), slump D has grown remarkably since 2014. Its impact on the stream is small relative to other slumps, but we're keeping a close eye on it. We will visit all of our slumps multiple times throughout the summer to track changes in carbon concentration and water quality so we have a better understanding of how environmental conditions influence slumps and streams. The thin layer of snow at the base of the slump in this photo will surely melt within the next week or two and expose buried glacial ice! (see photo below) 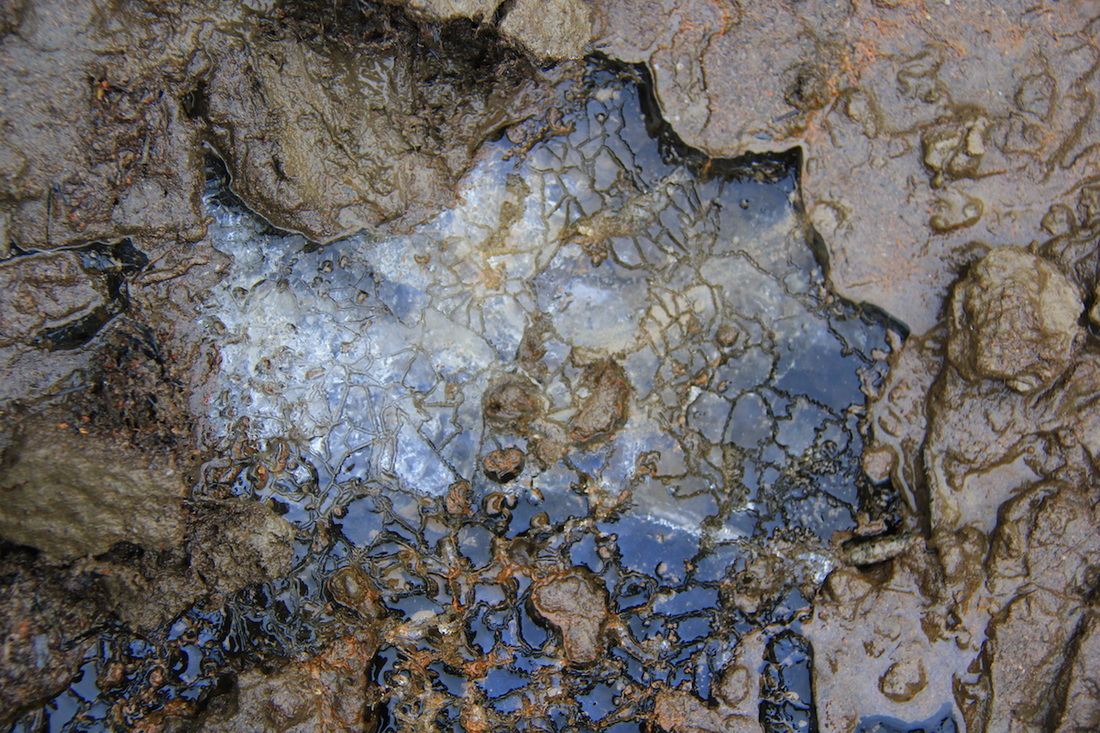 Glacial ice exposed at the base of Slump D. Glacial ice underlies the Peel Plateau, making it particularly susceptible to ground collapse under increasing air temperatures and, consequently, thaw slump development. 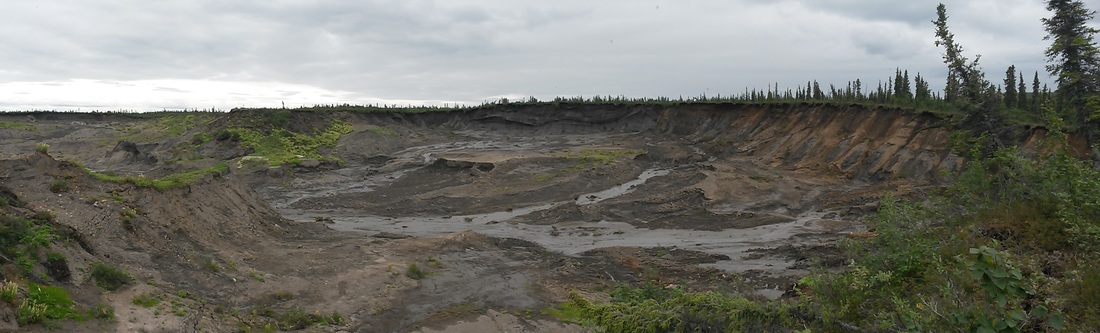 "Slump B", looking east towards the ice-rich headwall, from which streams of melting permafrost ice carry carbon-rich material into nearby streams. This permafrost carbon can be degraded by microbes and converted into CO2, thus increasing atmospheric greenhouse gas levels. Through mineral weathering, the CO2 in streams might also be fixed as bicarbonate and removed from the active carbon cycle, thus tempering (to some extent) greenhouse gas emissions associated with similar disturbances. The balance between CO2 release and fixation is key to understanding the role of thaw slumps in the carbon cycle, yet understudied. That's why we're here! Our first day of sampling streams and thaw slumps by helicopter! 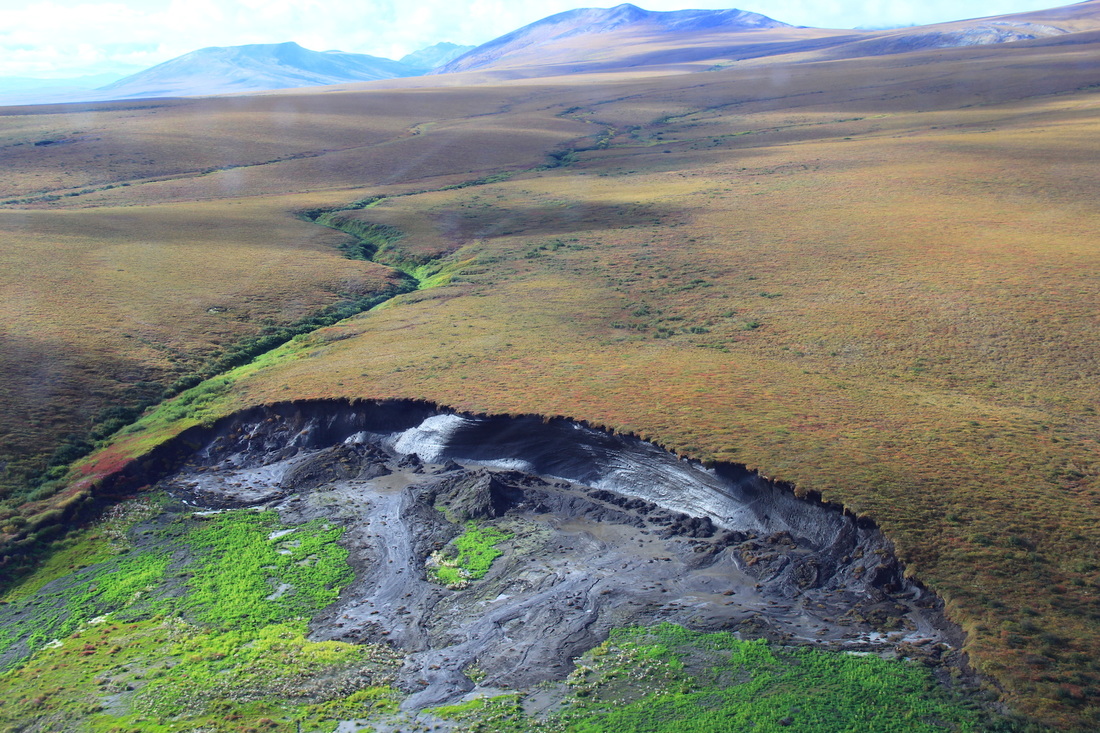 Helicopter slump A. This is one of my favorite sites because it's at the base of the Richardson Mountains and is a spectacular area. Even more so, because this thaw slump provides a clear, fantastic example of the abundant ice-rich permafrost on the Peel Plateau. Notice the ice-rich headwall reflecting light from the afternoon sun. This photo makes it easier to imagine how various environmental factors - for example, warm air temperatures, sunlight, and precipitation - drive slump growth and activity. Admittedly, the photos of these slumps from June 2016 didn't turn out too well, so this photo and the two below were taken in August 2016. 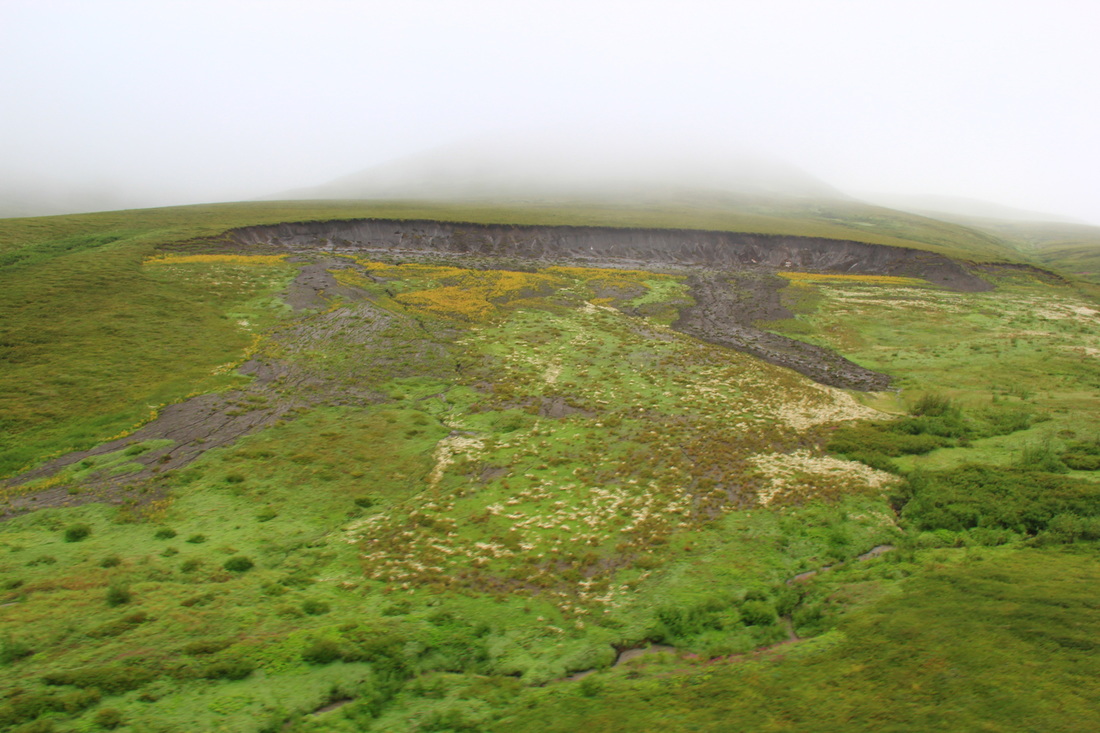 Helicopter slump B. This thaw slump provides a nice example of how topography influences thaw slump development. Thaw slumps that form in steeper stream valleys may be relatively deeper than thaw slumps (like Heli B) that form on more gently-sloping tundra. Even though such slumps might not always expose permafrost at similar depths, the can grow quite wide and have impressive debris tongues flowing out from the headwall. We can see that Heli B had two debris tongues at the time this photo was taken. We can also see that vegetation in the disturbed area near the base of the headwall is different than on the tundra. Notice, in particular, the yellow Mastadon flowers (Senecio congestus), which are known to colonize in active thaw slumps because they favor saturated soil conditions, like those near the base of thaw slump headwalls (Lantz et al. 2009, Cray and Pollard 2015). Lantz, T. C., Kokelj, S. V., Gergel, S. E., & Henry, G. H. (2009). Relative impacts of disturbance and temperature: persistent changes in microenvironment and vegetation in retrogressive thaw slumps. Global Change Biology, 15(7), 1664-1675. Cray, H. A., & Pollard, W. H. (2015). Vegetation recovery patterns following permafrost disturbance in a Low Arctic setting: case study of Herschel Island, Yukon, Canada. Arctic, Antarctic, and Alpine Research, 47(1), 99-113. 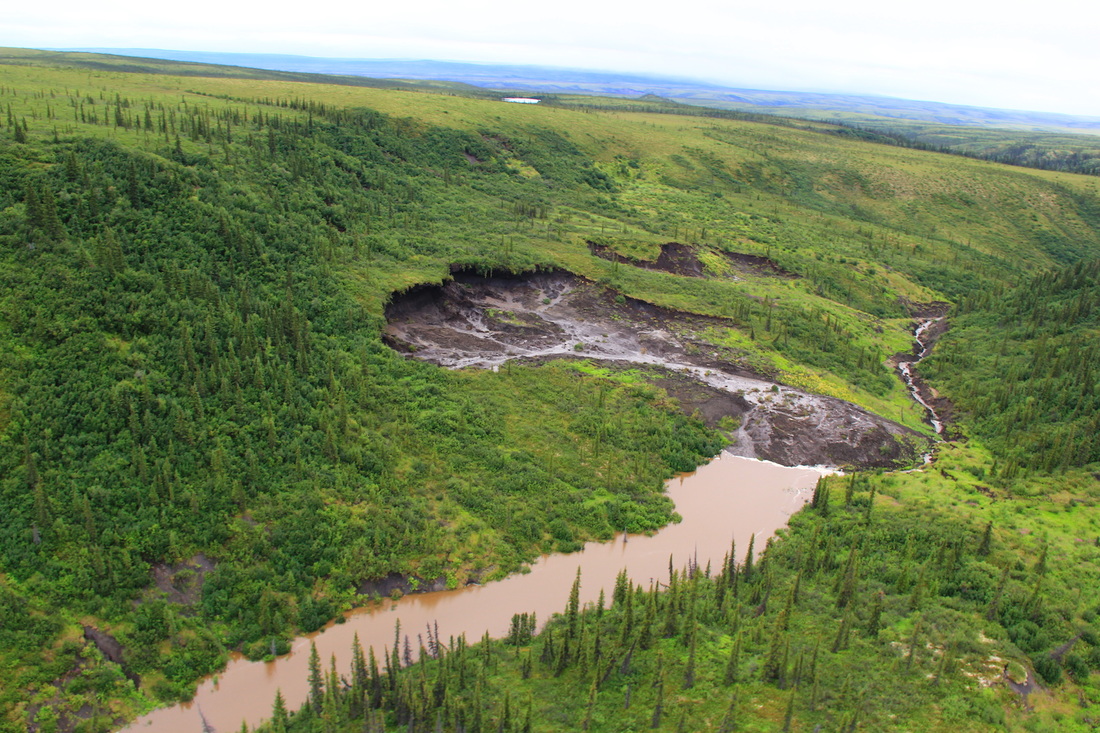 Helicopter slump D. Two weeks of heavy precipitation in mid-July eroded material from the interior of the slump, extending the debris tongue outwards and into a stream. The result? A new pond on the Peel Plateau! Notice the color of the pond, attributed to influx of relatively fresh permafrost material. On our first helicopter day, in June, we deployed a temperature sensor upstream of the thaw slump, only to find it submerged in the new pond on our second helicopter day, in August. Such is life! If we can recover the sensor during summer 2016, though, it may provide a wealth of information. 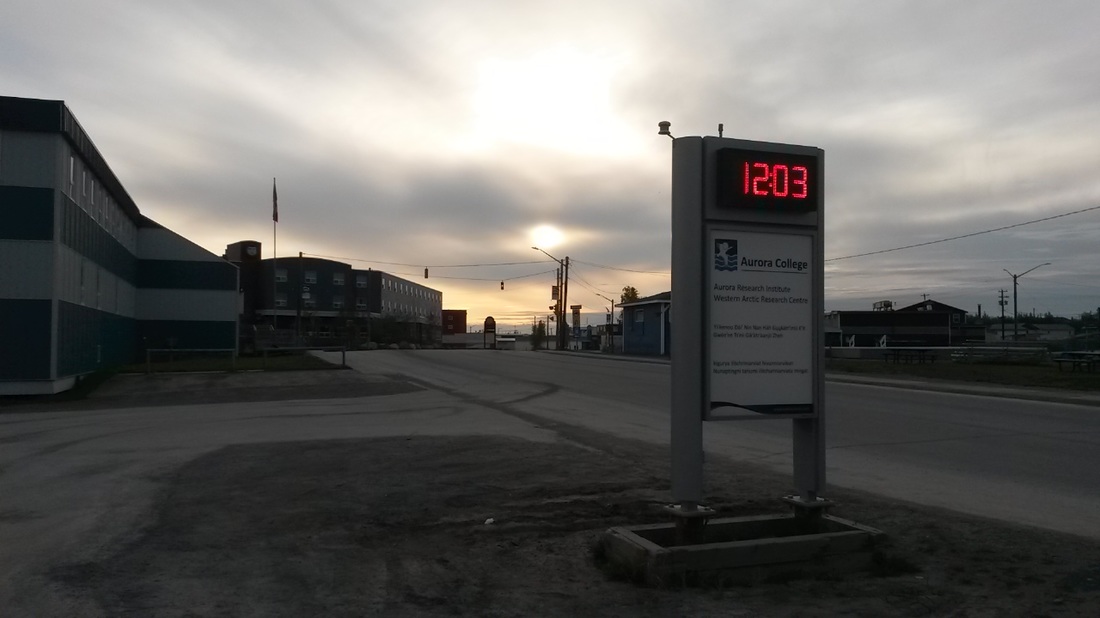 At 68°21′42″N, Inuvik is roughly 2˚ north of the Arctic Circle and 100 km south of the Arctic Ocean. During the summer months, 24 hours/day of sunlight is energizing. Although, it's easy to lose track of time and work well into the night. Over the past two summers, Inuvik has felt increasingly like a second home because we spend entire summers in Inuvik for our fieldwork. Importantly, the Western Arctic Research Centre (WARC), part of the Aurora Research Institute, is in Inuvik. The excellent staff, facilities, and location of WARC make it a fantastic home base for fieldwork in the western Canadian Arctic. In big part because of WARC, Inuvik is a hub for research in the western Canadian Arctic. It's an exciting place to have as a second home because there's a lot of interesting research and great researchers in this part of the world. It's exciting to spend several months here engaged in research and immersing myself in that of other scientists! I'm thrilled to be back and excited for what's to come this summer.
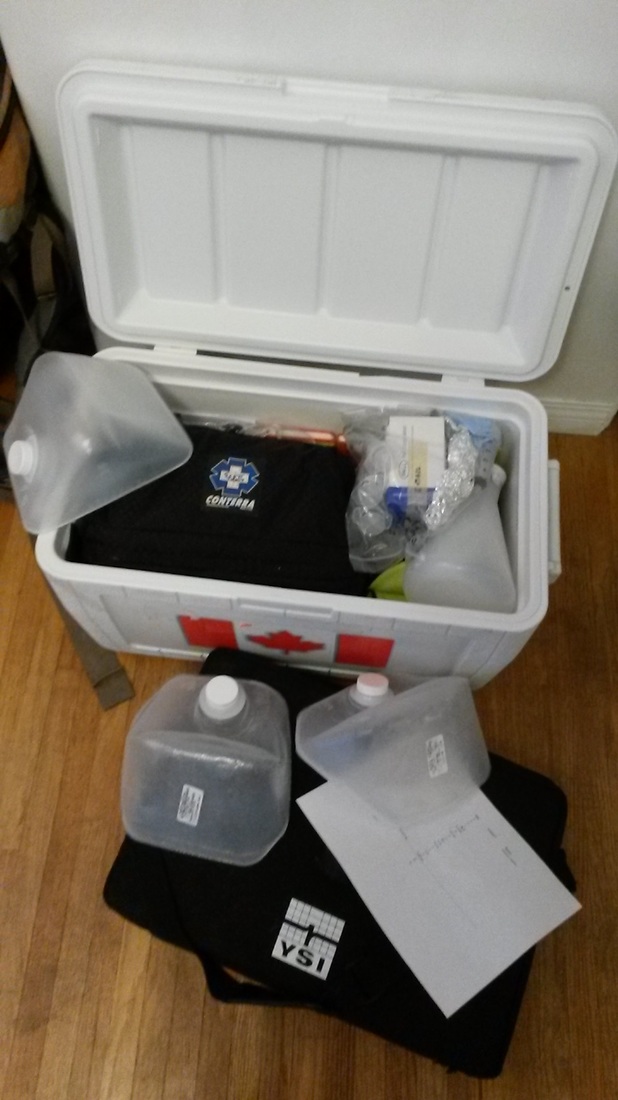 Efficiently packing supplies into a cooler can be a lot like tetris. We shipped ~30 similar coolers to the Northwest Territories for the upcoming field season, all filled with bottles, instruments, and other scientific supplies.
|
Author(s)Scott Zolkos Archives
August 2016
Categories |
 RSS Feed
